

Moving averages (or MAs) can be adapted to be momentum indicators as well as support/resistance markers. By plotting multiple moving averages of different time spans on our charts, we create a useful momentum indicator, the moving average crossover.This lesson outlines the two types of moving average crossovers that can be used to indicate price momentum.
ADDITIONAL READING ABOUT MA CROSSOVERS AND SIMPLE SYSTEM
The use of Moving Average crossovers is a popular way for traders to use Moving Averages. A crossover occurs when a faster Moving Average (i.e. a shorter period Moving Average) crosses either above a slower Moving Average (i.e. a longer period Moving Average) which is considered a bullish crossover or below which is considered a bearish crossover.
Crossovers are thought to signal momentum change in the markets. When the main indicator crosses a predefined signal line, the trader will interpret this as a warning sign that something is changing with respect to either momentum of the price action, or its direction. But as we mentioned, crossovers are relatively common, and a strategy based on them alone is unlikely to work well in the absence of confirmation from other sources.
The signals generated by a crossover can be useful in a ranging or trending market, but in a trending market, a crossover is a less significant development than in a ranging market.
Moving Average crossovers are important tools in a trader’s toolbox and are included in the most popular technical indicators.
MA CROSSOVERS AND SIMPLE SYSTEMS PART 1 - TEXT VERSION
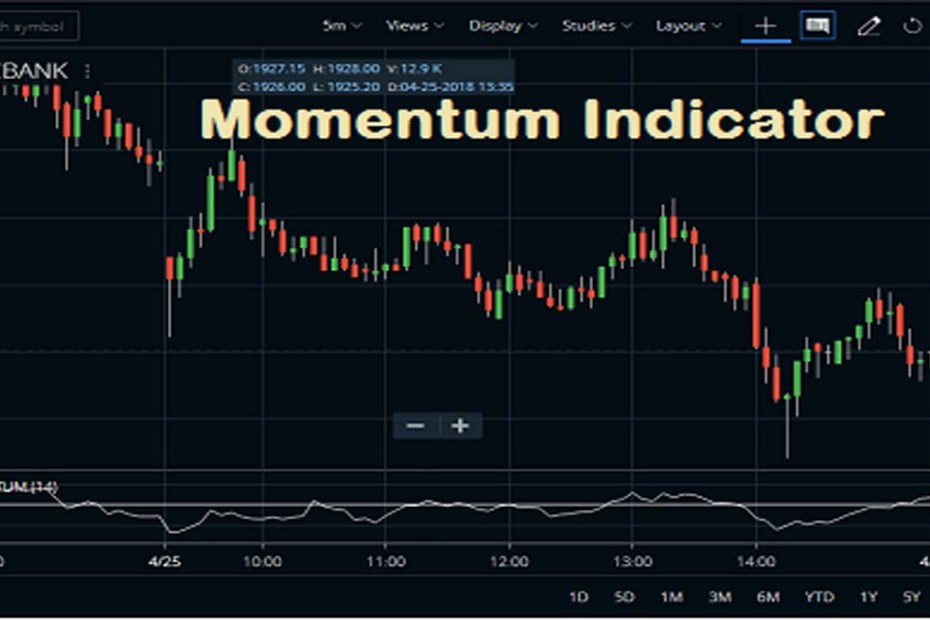
There are many other useful momentum indicators. One of them is moving average crossovers.
Like Bollinger Bands, moving averages can also be adapted to be momentum indicators as well as S/R markers. By plotting multiple moving averages of different time spans on our charts, we create a useful momentum indicator, the moving average crossover.
Moving averages can be adapted to be momentum indicators as well as S/R markers.
MOVING AVERAGE CROSSOVERS
Moving average crossovers come in two types:
The first type is price which crosses over or under a given moving averageThe second one is shorter-duration moving averages which cross over or under longer, slower movingaverages.
Each type signals changing momentum that could be an early signal of a changing price trend.When the price crosses over or under an important moving average, that crossing can be a signal of a possible momentum change, which in turn signals a trend change.
Rather than rely on just DBBs to signal changes in momentum, you’ll get a more reliable signal of changes in momentum and trend by waiting for confirmation from one or more other momentum indicators, like MA crossovers.
For example, traders using both types of signals would not close a long position until BOTH of the following signals occur:
- Price moves below the DBB buy zone, AND
- Price moves below the DBB buy zone, AND

Look what happened to gold from May 2009 to August 2011.
Source: MetaQuotes Software Corp, and The Sensible Guide To Forex: Safer, Smarter Ways to Survive and Prosper From The Start (Wiley & Sons, 2012)
From May 2009 to August 2011 it kept hitting new all-time highs, and had only eight down months out of 27, rarely pulling back to anything more than very near-term support levels.
Those waiting for significant pullbacks never got in and missed the biggest trend of the year, as gold steadily hit new all time highs.
We traders and investors get paid for being right about what happens in the future. However the S/R indicators we’ve covered thus far tell us about what happened in the past. While that’s helpful for predicting future price behavior, S/R indicators can only tell us about the strength of S/R levels. They’re missing the other half of the picture - they can’t tell us about whether a trend is strong enough to break past a certain S/R level. Moreover, they can’t tell us anything about future price movements when a currency pair or other asset has broken past all prior S/R to new historic highs or lows.
What’s a trader to do? Use a momentum trading style, with momentum indicators.
MOMENTUM INDICATORS
They can give us a better idea of future price movements because:
- They show whether a trend is strengthening or weakening.
- They can tell you if an asset is overbought or oversold relative the price range over a given prior period.
In short, momentum trading with momentum indicators can give you additional clues to put the odds of being correct even more in your favor.
There are many momentum indicators, but for now we’ll just introduce a few of the most effective and easiest ones to use:
- Double Bollinger Bands.
- Moving average (MA) crossovers.
- Three kinds of basic oscillators: Moving Average Convergence/
Why The Gold Chart? A Brief Introduction To Inter-Market Relationships And How To Profit From Them
By the way, were wondering why we referred to a gold chart in an article on currencies?
The reason is that for a variety of reasons, currencies and commodities are often interrelated, and so at times are traded as proxies for one another.
For example, because Canada is a major oil producer, the CAD often moves with the price of oil. Under certain conditions, it makes more sense to trade a CAD currency pair than oil, and vice versa.
Gold is a special case, because it’s considered the primary hedge against currency devaluation. When investors are worried about the falling value of one of the most widely held currencies (especially the USD and EUR), gold may rise.
Therefore at times when the fundamentals for both the EUR and USD aren’t good, but it’s unclear whether to be long or short the USD, traders will instead play it safe and just go long gold. We’ll see that happening during times when there’s a lot of anxiety about the stability of large parts of the global financial system. For example, gold has tended to rise during bouts of great concern over the EU sovereign debt and banking crisis. In times like those, traders often pile into gold because:
- The EUR looks like it might not even survive
- The Fed may be printing dollars like crazy in order to help out Europe and to bolster the US economy from the fallout of an economic crash in the EU
We’ll cover this and other inter-market relationships, and how to use them, later.
How They Work
As their name suggests, momentum indicators focus on rate of price change. While the exact mathematical calculations and emphasis vary among momentum indicators, they all attempt to provide a certain perspective on:
- Whether price is changing at a faster or slower pace
- Whether that changing rate indicates trend strength or weakness
For example:
- A steady increase in the speed at which price is rising or falling suggests trend strength
- However, too rapid an acceleration is often interpreted as a sign of ‘trend exhaustion’ or a ‘blow off’ top (or bottom for downtrends) that suggests a final dramatic surge in optimism (or pessimism for downtrends) that drains out the remaining buyers (or sellers for downtrends) and sets up the end of an trend and coming trend reversal.
When that happens, you’ll hear analysts say that the pair is either:
- Overbought” if price has risen to fast or for too long, and thus is expected to reverse and move lower
- “Oversold” if price has fallen to fast or for too long, and so is expected to move higher

FIGURE 8.9 Gold Daily Chart, June 10 to September 30, 2010
Note that during the months of October and November of 2010, gold fell twice out of its upper DBB buy zone but never made a clear lasting move below its 50 day SMA.
Those who used only the DBB rules lost time and money closing and then re-entering long positions as gold bounced out of and back into its DBB buy zone.
In contrast, those who held their long positions until they saw confirmation that the uptrend was over from both of the two signals below, continued to ride the trend higher.
- Price moving below the DBB buy zone
- Price crossing below the 50 day EMA to confirm a change in momentum and the trend
Similarly, traders using both indicators to confirm momentum changes might not take bets on new up trends until they get confirmation of strong upward momentum from both of the following signals:
- Price crossing above the 50 period SMA
- Price entering the DBB buy zone
Traders using both indicators to confirm momentum changes might not take best on new down trends until they got confirmation of strong downward momentum from both of the following signals:
- Price entering the DBB sell zone
- Price crossing under the 50 period SMA
03 Comments
“TM Academy is a great foundation for learning how to trade, do not think you take a class and then you're a trader. It takes practice and patience to be proficient.”
“I really appreciate the level of knowledge of our Forex Instructor. His qualifications for teaching the class are the highest i could imagine. I'm very excited about what we have learned here and looking forward to putting it into practice.”
Scot was extremely helpful in his teaching methods. ”